Add Points Coordinates, Date & Time for Drawings
Hi,
Can you please add the inputs for point/s coordinates, date & time to the drawing tools (rectangle, rays, trendlines etc...)?
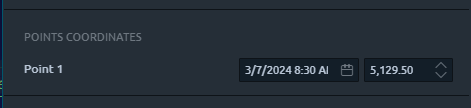
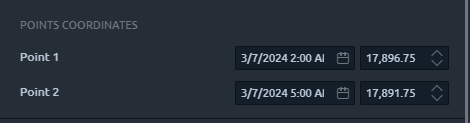
I have specific times & levels I chart each day & it would be a huge help if these data points can be manually inputted in drawing settings, as opposed to having to move drawings manually. Each morning, considering these drawings always remain on my charts. On my other platform (Quantower) I just select the appropriate drawing, type in the date/time/price in the settings & it's exactly where I need it to be. This saves a great deal of time each morning.
I've attached two different screenshots of settings to show you exactly what I'm looking for. The single point one shown is for single lines (rays, trendlines etc...) & the two point one shown is for rectangles/geometry etc...
Thank You so much!!
Log in to comment and vote
No comments yet
Be the first to share your thoughts.