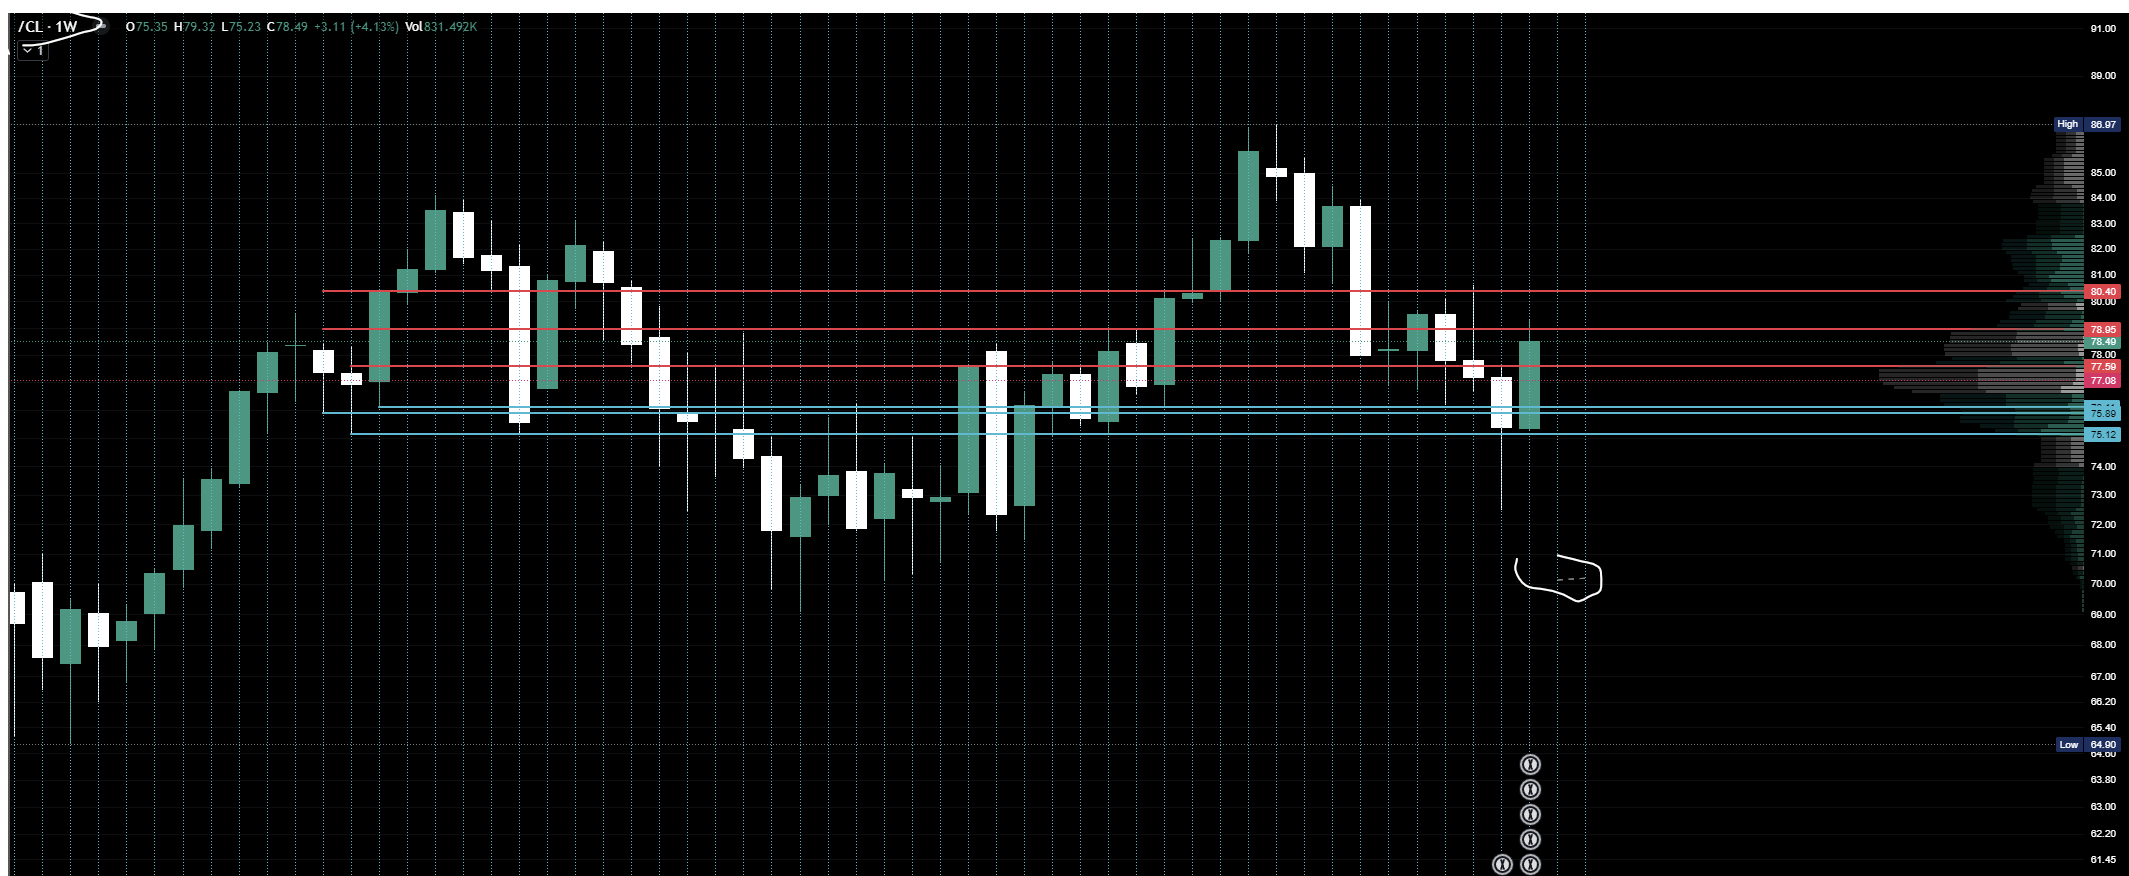
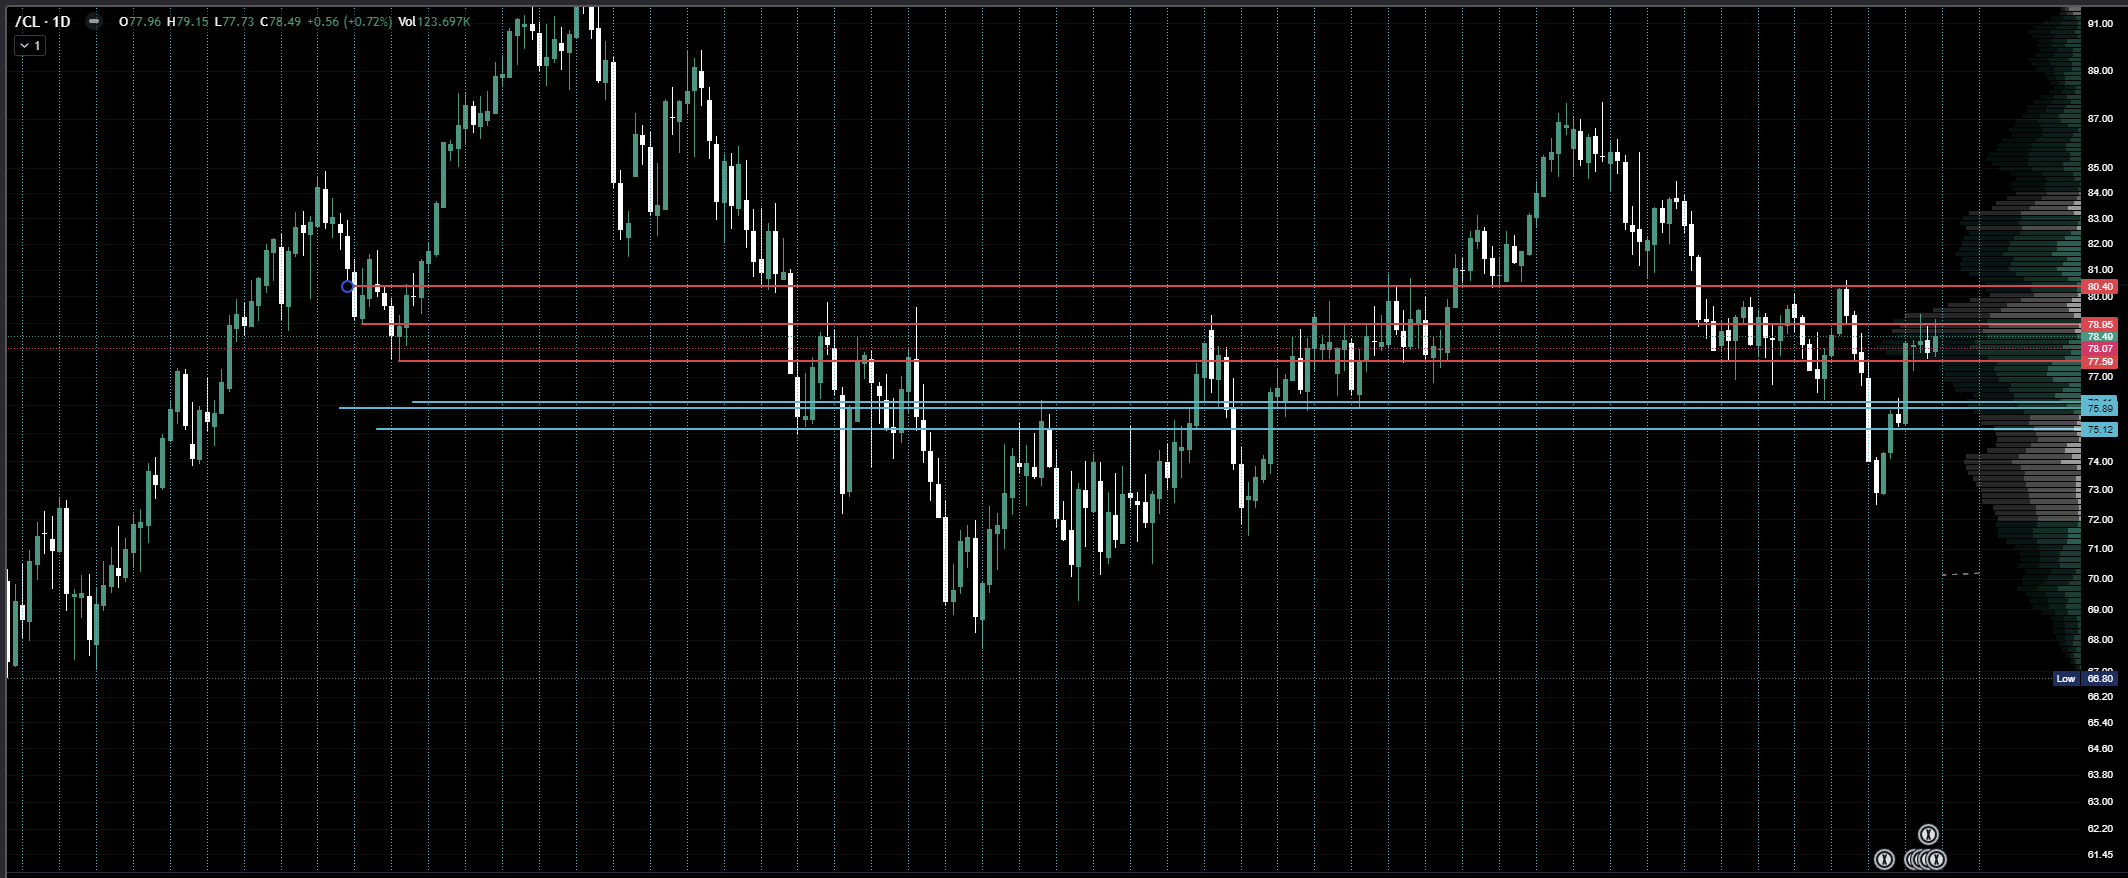
Continuous charts or seperate issue?
Note that I've set weekly cyclic lines meaning each line across smaller timeframes SHOULD start the new weekly cycle
As for the red lines (daily) and blue lines (weekly), the should all represent a low of the bracketed time spans which is from a weekly session as noted above but the lines don't match up any of the lows at all. Blue lines showing lows of 3 separate weekly candles are showing NO candle contact within those sessions where as the daily lows shown DOES NOT match the weekly chart at all. Even with minor discrepancies, the blue lines should at least make contract with some candles on the daily but it is literally in no man's land on the daily chart. Can this be fixed? or what exactly is the cause of this?
Please authenticate to join the conversation.
In Review
💡 Feature Request
Charts
Almost 2 years ago

goldeneraprofits
Subscribe to post
Get notified by email when there are changes.
In Review
💡 Feature Request
Charts
Almost 2 years ago
goldeneraprofits
Subscribe to post
Get notified by email when there are changes.